Ecosystem Map

Describe all the entities, flows and relationships that characterize the surrounding ecosystem.

applied for

Research

Experts

Stakeholders

System

Map

also called

Actors Map, Ecology Map

what is it

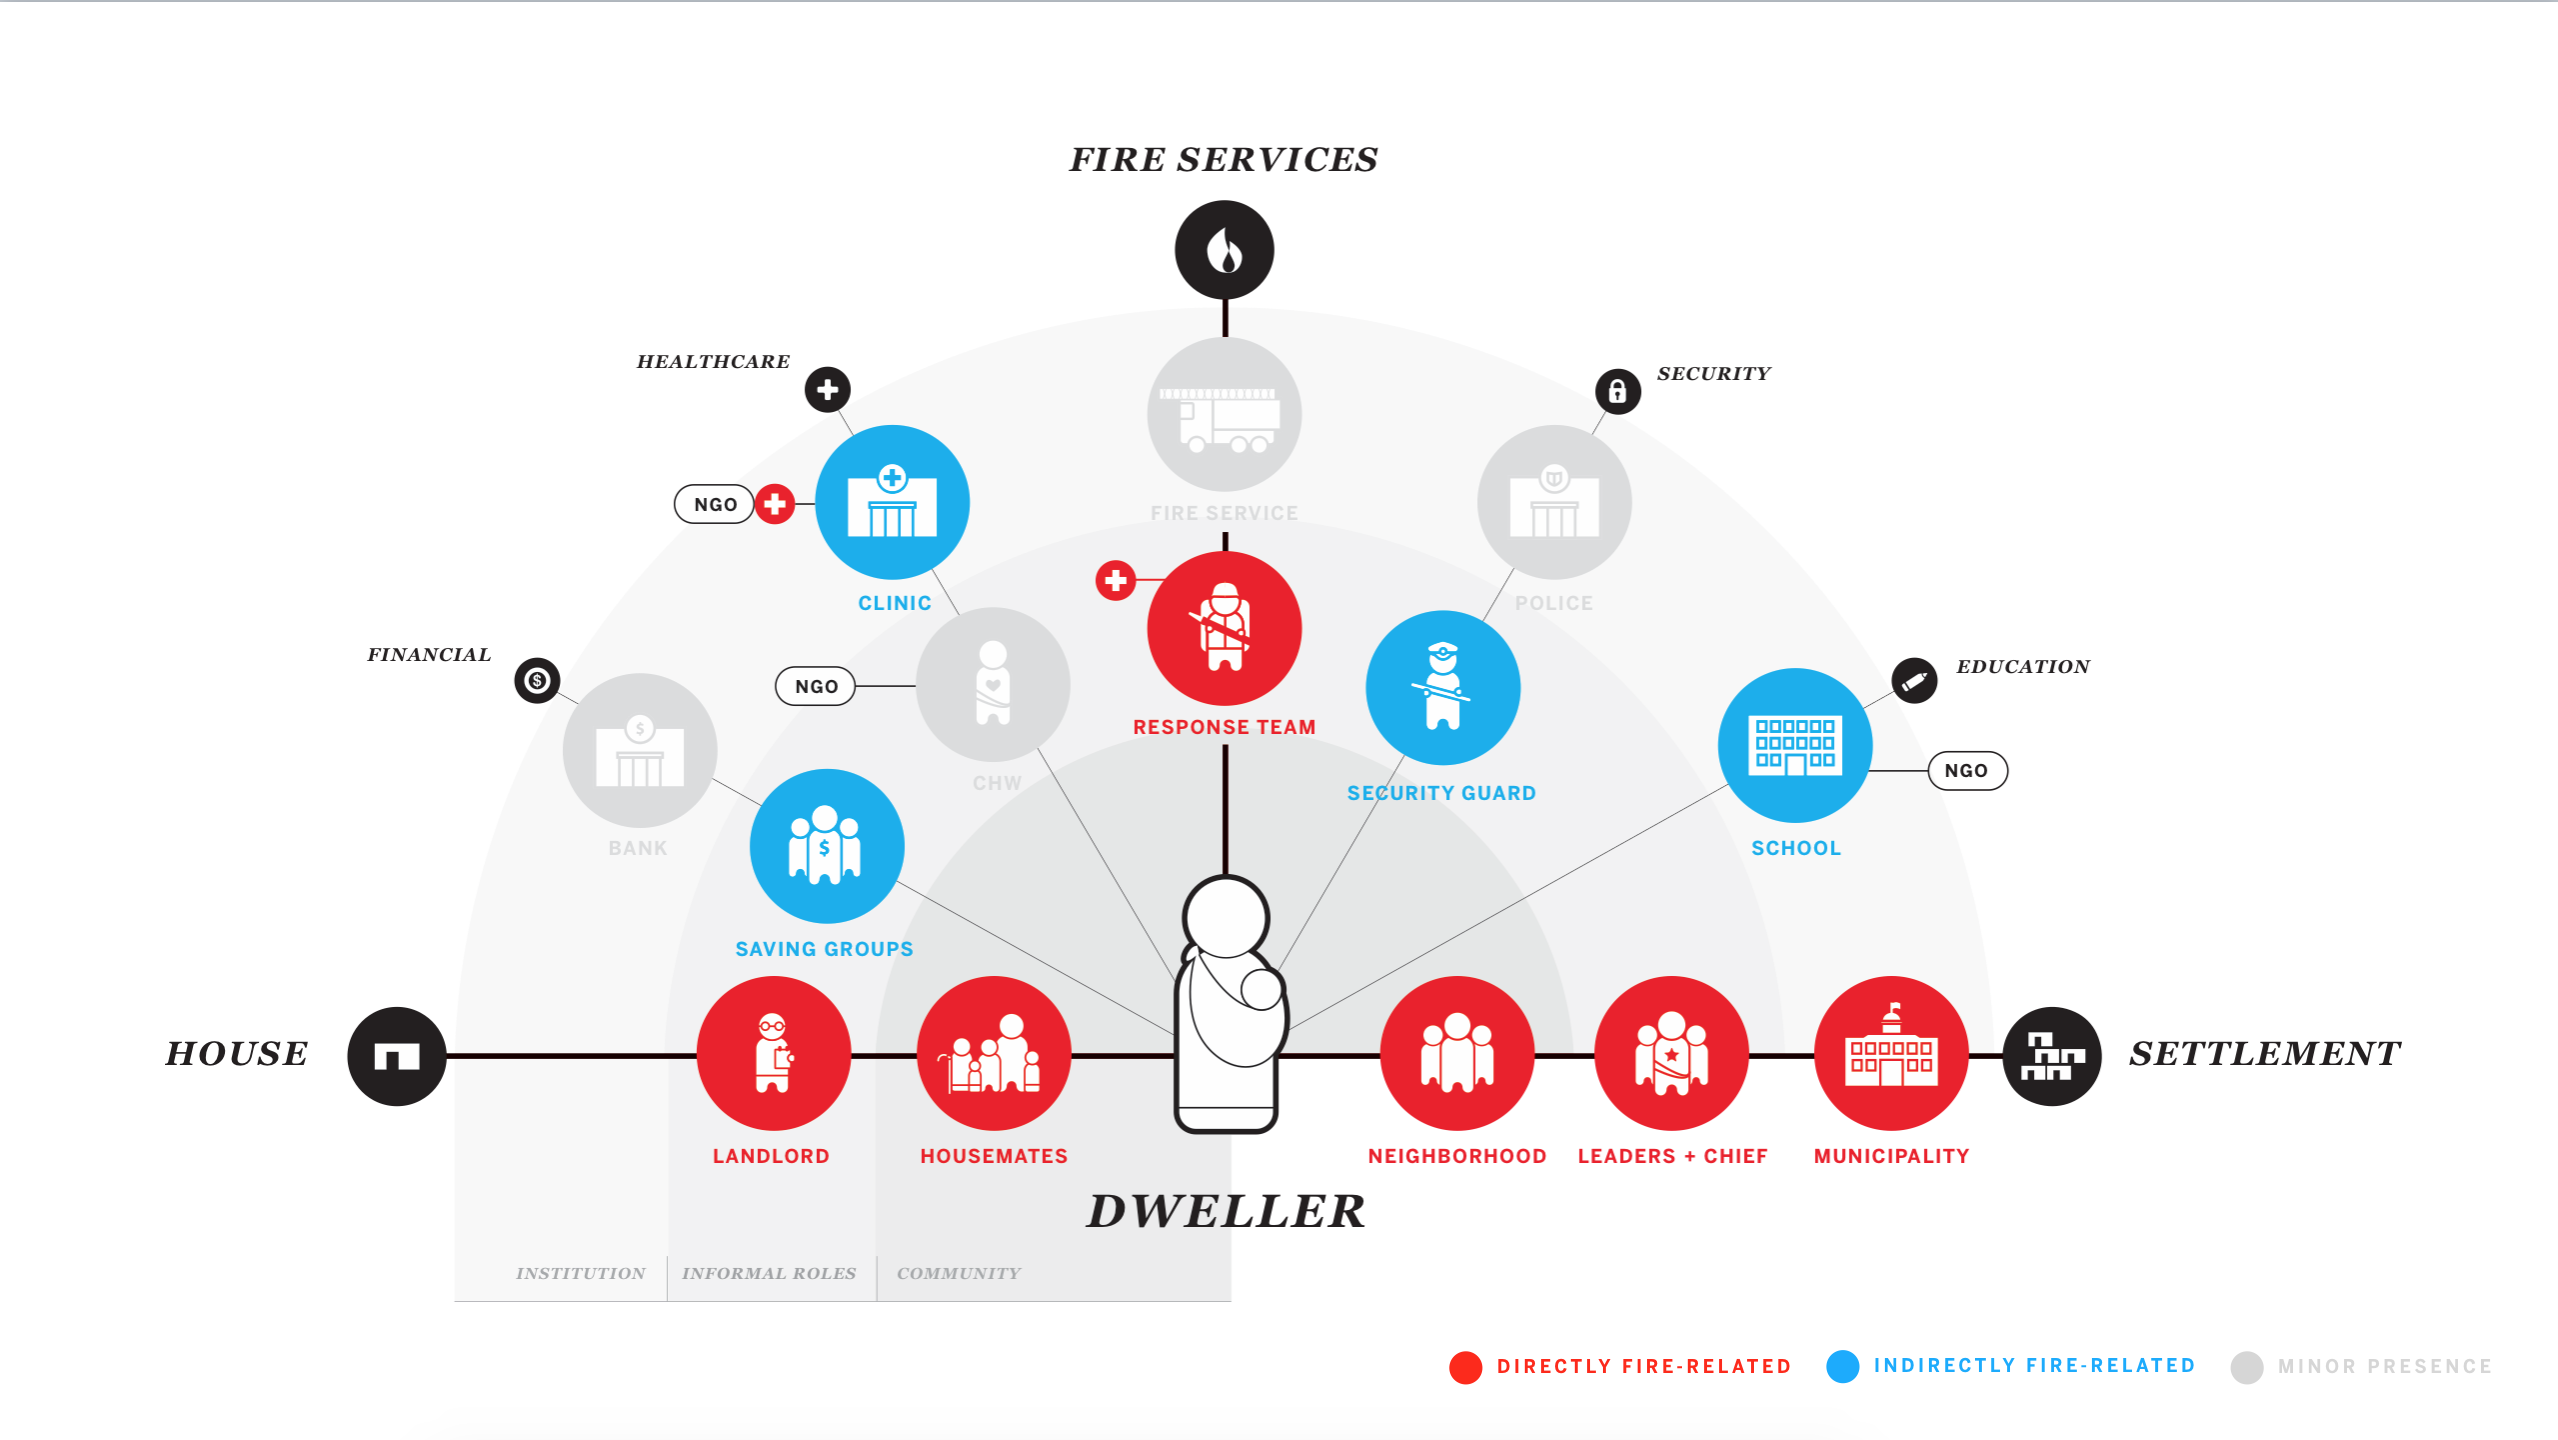
The ecosystem map is a synthetic representation capturing all the key roles that have an influence on the user, organization and service environment. The ecosystem map is built by first displaying all the entities, and then connecting them based on the type of value they exchange.

use it to

Uncover existing gaps and identify valuable opportunities for synergies.

remember to

Map all the relationships as a giving and a receiving: the value is in the loops.

step by step guidelines

01

Identify all players and entities involved in the service supply and delivery.

Search in depth also for players operating behind the scenes, as well as the ones not directly involved with the service but that have nevertheless an impact on it.

02

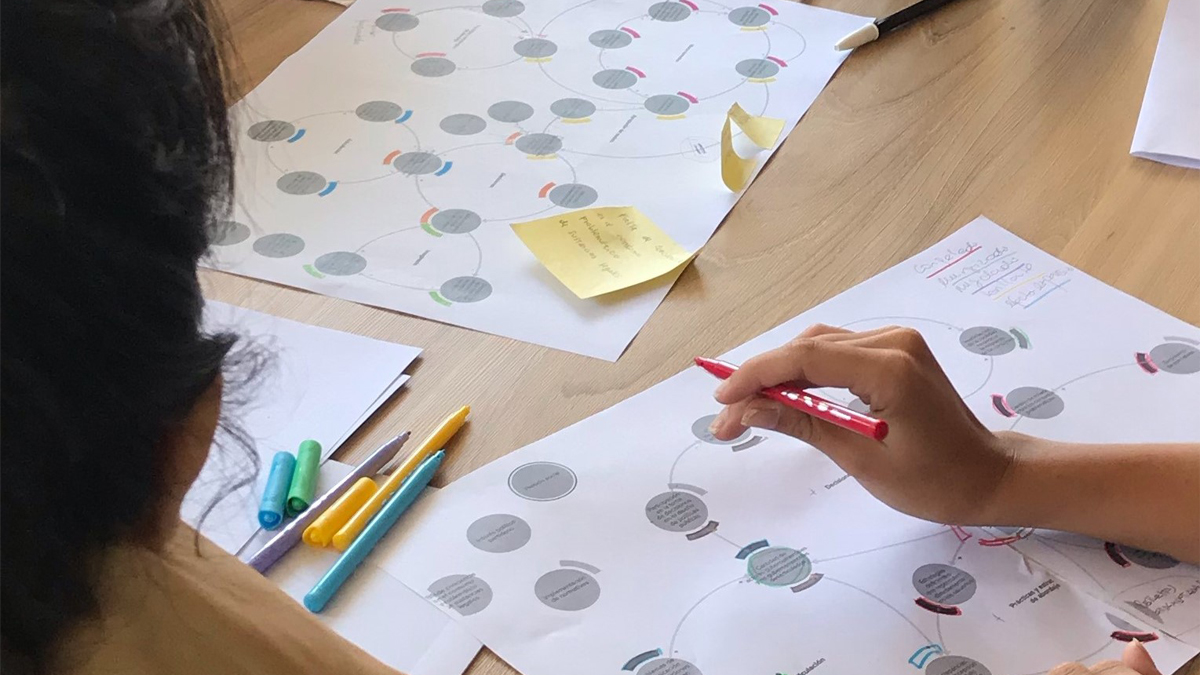
Place the user at the center of the worksheet, then position the other players in the space around. Try to put closer to the center the ones that have more importance for the user. When they are all on the map, start tracing connections between the user and other players and then among the latter.

Use different types of line (appearance, colour, stroke) to represent different kinds of relationship such as information exchange, money exchange, etc.

03

Take a step backwards and observe the map. Do you notice anything missing? If you are not just by yourself, discuss within the team.

Add erasable hand-written notes or use post-its, in order to keep note of emerging observations and discussions.

04

Drawing on the new additions, highlight pain points or gaps in the map. This activity helps in understanding which aspects need to be improved or further explored, and to share these insights with other team members or stakeholders.

Keep visualizing any new detail noticed on the map, for example using further colors or dividing the players in sub-sets.

case studies

1

feature image of 'An ecosystem map to better understand fire safety in informal settlements' case study

Example by frog

An ecosystem map to better understand fire safety in informal settlements

Visualise all the services and actors involved in the fire prevention and intervention and be able to compare different context

description

frog has been working with American Red Cross and other partner organizations in order to design and develop prevention solutions to the dangereous fire break-outs that often destroy entire informal settlements. In the initial phases of the project, the team engaged several local stakeholders in two cities (Nairobi and Cape Town) with the goal of understanding all the local services and actors involved in the fire prevention and intervention. The activity started with a rough paper-based diagram build during co-design sessions, and ended up in a consolidated framework, describing the spectrum of services sorrounding the individual dwellers and their communities. The map allowed to identify the actors involved in the emergency, and the related flow of information and communication, highlighting gaps and interruptions.

what is interesting

By keeping the same structure to look at the fire-safety ecosystems in different places (e.g. Nairobi, Kenya vs Cape Town, South Africa), the maps immediately clarify similarities and specificities. This helps planning programs and designing modular solutions, that could adapt and scale across different geographies.

Read more about this case study

View more

2

feature image of 'Mapping Argentina's addiction prevention and regulation system' case study

Example by Neti

Mapping Argentina's addiction prevention and regulation system

Gain clarity and develop a deep understanding of the entire ecosystem

description

Sedronar held four co-creation workshops with a multidisciplinary team of 7 public servants and 2 designers facilitating the work sessions. It was the first step in their internal processes research, aimed at understanding obstacles and difficulties to improve their approach towards prevention of addictions. The objective was to gain clarity and develop a deep understanding of the entire ecosystem, building a map that captures the key forces and patterns driving the system’s behavior.

what is interesting

The map helped the organization to reflect about (and partially judge) the work done so far and highlighted how certain factors influence the system’s functioning in diverse ways that are not always taken into consideration.

Read more about this case study

View more