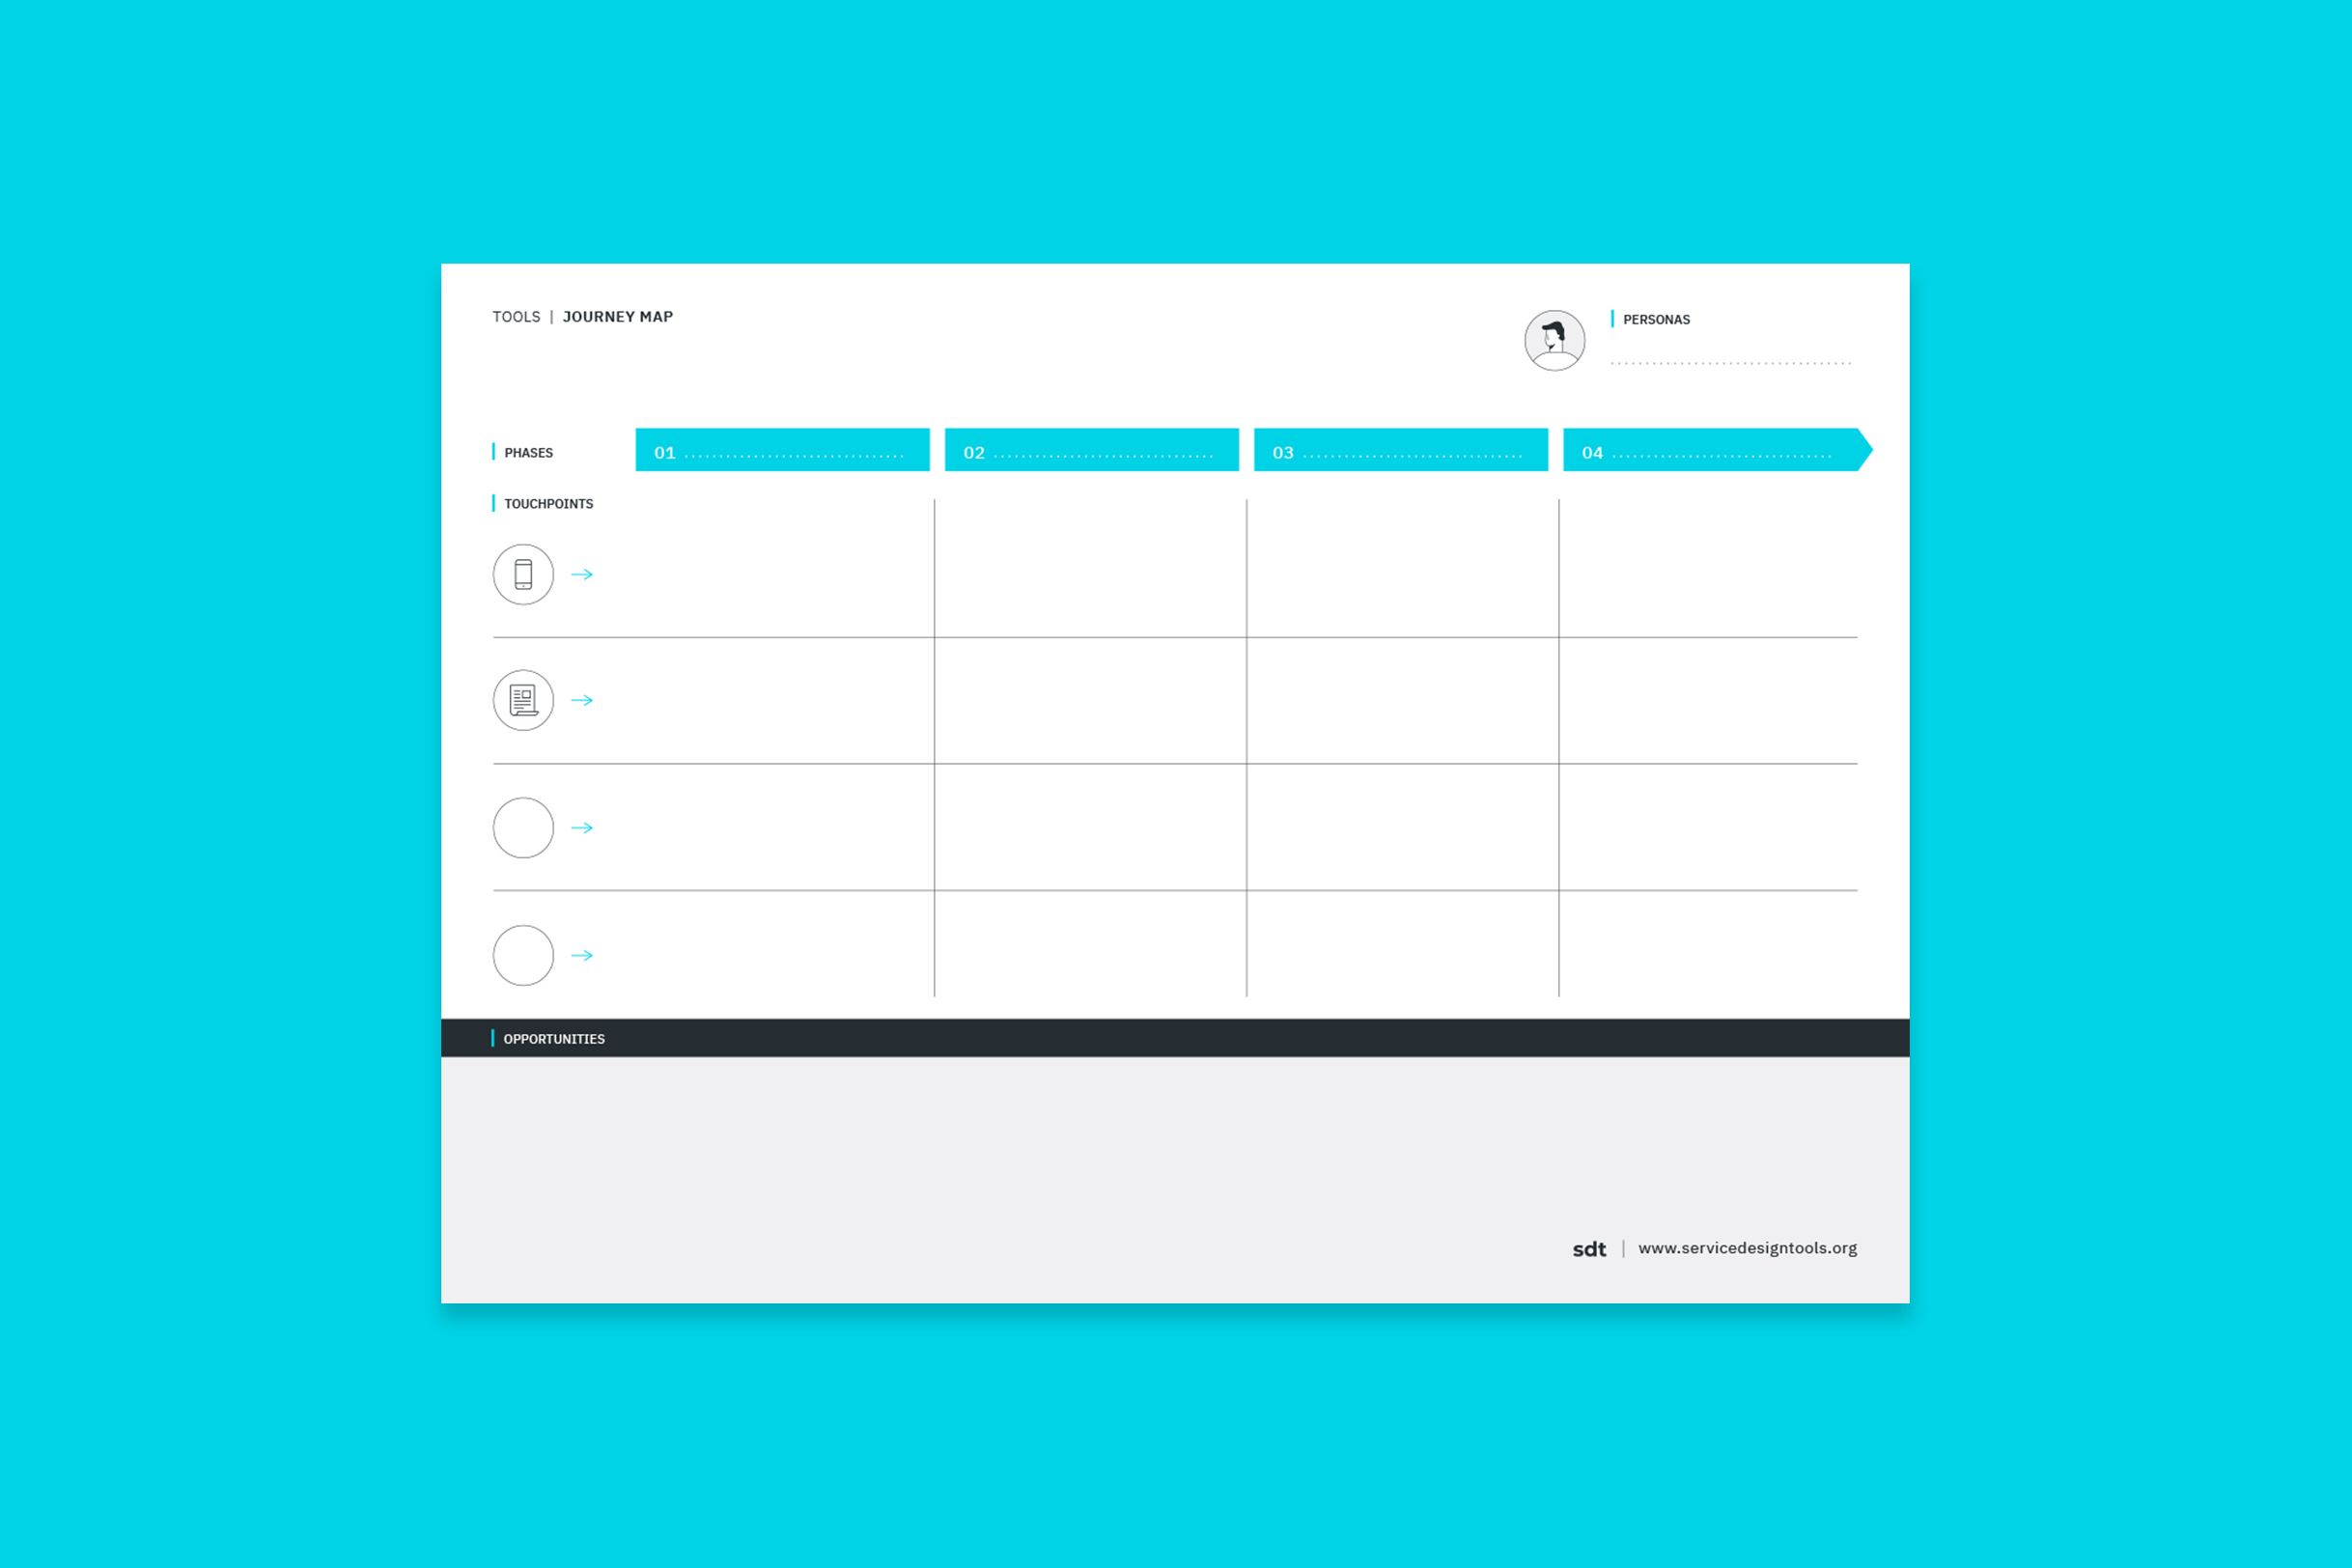
tool description
The customer journey map is an oriented graph that describes the journey of a user by representing the different touchpoints that characterize his interaction with the service. In this kind of visualization, the interaction is described step by step as in the classical blueprint, but there is a stronger emphasis on some aspects as the flux of information and the physical devices involved. At the same time there is a higher level of synthesis than in the blueprint: the representation is simplified trough the loss of the redundant information and of the deepest details.

THE TRAINRIDE
Building a customer journey implies the observation of the user experience and the representation of that experience through its touchpoints.
The example shown here is a rough sketch used for the construction of a customer journey map (in this case the map is referred to a simplified train ride). The starting point is the identification of the touchpoints as the elements of the service interface that establish the relation between the user and the organization. The touchpoints can be physical, virtual or human. The user experience is obtained by connecting the different touchpoints in a sequence.
finding & recommendations FOR ALIGNING OGT SERVICE TOUCHPOINTS
Three OGT (Oxford Gene Technology) customer segments were interviewed to give insights into their experiences of interacting with OGT’s services. The information collected were then used for building three customer journey maps, reflecting the experiences gathered, highlighting the stickling points and comparing OGT to competitor services.
The identification of a structured graphical language for the representation is very useful here, allowing the description of several experiences with the same structure and criteria and facilitating the comparison between them.


